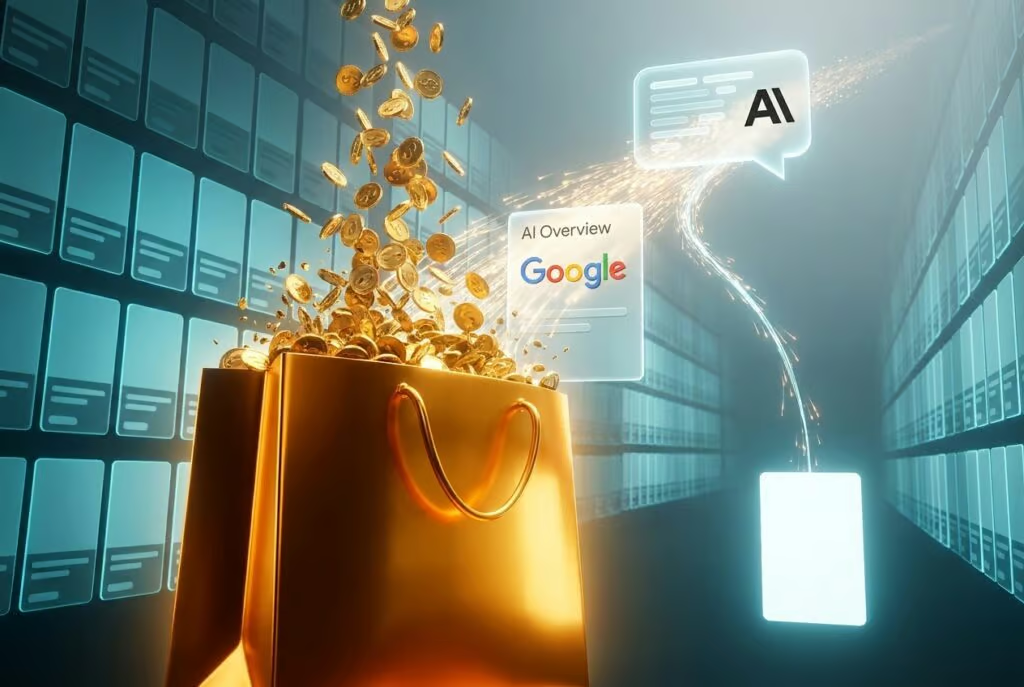
Across ecommerce businesses, year-on-year organic traffic is falling while revenue holds steady or climbs, breaking the decade-old rule that more clicks means more sales. The shoppers who used to click through early research now get their answers on the results page, through Google AI Overviews, product grids, review snippets, and LLM chats, so the click that survives arrives later, with more intent and more value. For small operators, that means the traffic chart you have trusted can now tell the opposite of the truth about how SEO is really performing.
Why It Matters
SEO has always had a “Red Queen problem.” In Through the Looking-Glass, the Red Queen has to keep running just to stay in the same place. SEO feels the same: you refresh pages, fix technical debt, update templates, and respond to competitors just to hold position. For years, total organic clicks were how teams judged whether they were running fast enough.
That signal is now weak. Rankings can hold, product visibility can stay strong, and motivated shoppers can still reach your site, yet total clicks fall because the SERP satisfied the research stage first. With Google AI Overviews and shopping modules answering more questions on the results page, the danger is that leadership sees a sinking traffic line and concludes SEO is failing. For a small operator with a lean budget, that misread can kill funding for the exact work that’s keeping revenue alive.
Winning in AI-era search can now look like fewer clicks but better clicks, smaller traffic sitting beside stronger revenue.
How Has the Ecommerce Search Journey Changed?
Think about how someone shopped online ten years ago. They started broad, “best leather belts”, and that would send them to review sites, category pages, maybe some affiliate pages calling themselves review sites. Then they would refine the search. More tabs, more pages, more clicking. Eventually they landed on a product listing page (PLP) or a buying guide on your site, compared options, clicked into a product detail page (PDP), and bought. Most of that messy journey happened on your domain, which made it gloriously easy to report on.
The modern ecommerce SERP, especially on mobile, is a different animal. Before a shopper ever reaches a retailer, they can see sponsored products, organic product grids, review snippets, prices, discounts, star ratings, filters, and an AI Overview. In effect, Google is starting to behave like the PLP, the shopper compares products, scans reviews, and checks price ranges without clicking through. If they’re asking an LLM instead, they may get a shortlist before visiting any site at all.
So awareness, interest, and consideration increasingly happen off your website. That doesn’t mean SEO stopped mattering. It means the click arrives later. By the time someone reaches you, they may already know what they want, not browsing, not comparing six tabs, just close to buying. That changes what a click means, and it changes which page does the work. The PDP, long treated as the final step, is now often the first page a shopper sees.
Which Ecommerce SEO KPIs Should You Trust Now?
The old dashboard hides the real signal. Here are the metrics ecommerce teams should weight more heavily, and the ones to stop overreacting to:
- PDP clicks, where the money is. If shoppers arrive later in the funnel, clicks into product pages tell you far more than broad traffic totals.
- PDP conversion rate, if a ready-to-buy visitor lands and doesn’t convert, something is missing: shipping, sizing, returns, or context the page assumes they already saw.
- Organic revenue, the language leadership understands. When someone asks if SEO works, revenue travels.
- Click-through rate, in crowded ecommerce SERPs, the question isn’t only whether your product appears, but whether your listing earns the click.
- Merchant Center clicks and impressions, feed quality, titles, images, pricing, promotions, and review signals all shape how products look in shopping surfaces.
- Year-on-year traffic for PLPs, blogs, and evergreen content, the metric most likely to mislead you now.
And the reason before-and-after reporting fails is that everything else moves at once, seasonality, a competitor’s price change, a core update, a PR spike. The answer is controlled SEO A/B testing, where the only honest question becomes:
“what happened while our change was live?”
What Comes Next
Some teams will be tempted to jump straight to AI-native metrics, brand sentiment inside AI models, share of voice in AI chats, query clusters in LLM tools. The guidance is to watch these but not yet build board reporting on them. Outputs vary, personalization changes answers, and the same prompt may not return the same response twice. There is no reliable AI “search volume” data equivalent to classic search. Interesting? Yes. Ready to carry your reporting? Not yet.
The more durable shift is structural: PDPs becoming the new landing pages. If product grids and AI-assisted journeys surface product pages directly, those pages have to do more jobs, reassure the shopper they’re in the right place, surface delivery, returns, sizing, availability, reviews, and specs, and answer the last questions before purchase. Work that older journeys pushed onto guides and PLPs now has to live on the page where conversion happens. Pair that with controlled testing using Google Merchant Center feed data, and you get a reporting story that survives a confusing dashboard.
What This Means for You
If you’re a small operator, the practical takeaway is to stop measuring your visibility by raw clicks alone and start asking whether you even show up in the surfaces doing the pre-click research. That’s a different audit. Run a check on your AI contactability, whether AI assistants and agents can actually find, describe, and recommend your business when a shopper asks. Then tighten your business listings so your name, price, availability, and reviews are consistent everywhere a product grid pulls from. If you haven’t yet, claim and verify your listing so you’re eligible to appear at all.
This is the same pattern we covered when Google’s own AI search guide warned against generic content, and when DuckDuckGo’s traffic surge showed shoppers want control over AI in search: the funnel is moving upstream, and the businesses that get described accurately by machines win the later, higher-intent click. To stay visible across the social surfaces that feed those AI answers, keep your profiles active and consistent with Feedsta, an AI social media manager that creates, schedules, and analyzes posts across platforms so your brand stays present wherever customers, and the models, look.
The Bigger Picture
Ecommerce isn’t shrinking and organic isn’t over, the commercial demand is still there, the journey just changed shape. Some of the clicks we used to count as SEO wins are being displaced into SERP features, AI summaries, and LLM chats, and the click that remains is often worth more. That’s an uncomfortable truth for a traffic chart but a workable one for a business: meet shoppers at the moment of intent, make the page they land on do the convincing, and prove your value with revenue and controlled tests instead of a number that no longer means what it used to.
FAQ
Why is my organic traffic falling while revenue stays flat or grows?
Because more of the shopping research now happens before the click. SERP features, product grids, AI Overviews, and LLM chats let shoppers compare products, prices, and reviews without visiting your site. The early, low-intent research clicks you used to count are being absorbed upstream, but the high-intent shoppers still click through when they are ready to buy. You end up with fewer clicks that each carry more buying intent, which can produce a smaller traffic number sitting next to stronger revenue.
Which ecommerce SEO KPIs should I watch in 2026?
Weight metrics tied to intent and money rather than raw volume. The ones that matter are PDP clicks, PDP conversion rate, organic revenue, click-through rate, and Google Merchant Center clicks and impressions. PDP clicks show whether motivated shoppers reach your conversion pages; conversion rate reveals friction; Merchant Center data shows how appealing your products look in shopping surfaces. Year-on-year traffic for PLPs, blogs, and evergreen content is the metric most likely to mislead you now.
Are PDPs really becoming landing pages?
Yes. Older models assumed shoppers entered through PLPs, category pages, or buying guides and saw context before reaching the product. Now product grids and AI-assisted journeys surface PDPs directly, so the product page is often the first thing a shopper sees. That means the PDP has to carry trust signals, delivery and returns info, sizing, availability, reviews, and specs that earlier pages used to provide. The landing page is now the conversion page.
Related coverage
Run a free scan to see your AI Visibility Score, SEO rating, and local citation accuracy.